Calculating an inventory discrepancy starts with a simple subtraction: discrepancy = actual stock - theoretical stock. You then convert it into value, by multiplying by the unit cost, and into a rate, to compare items and track stock accuracy over time.
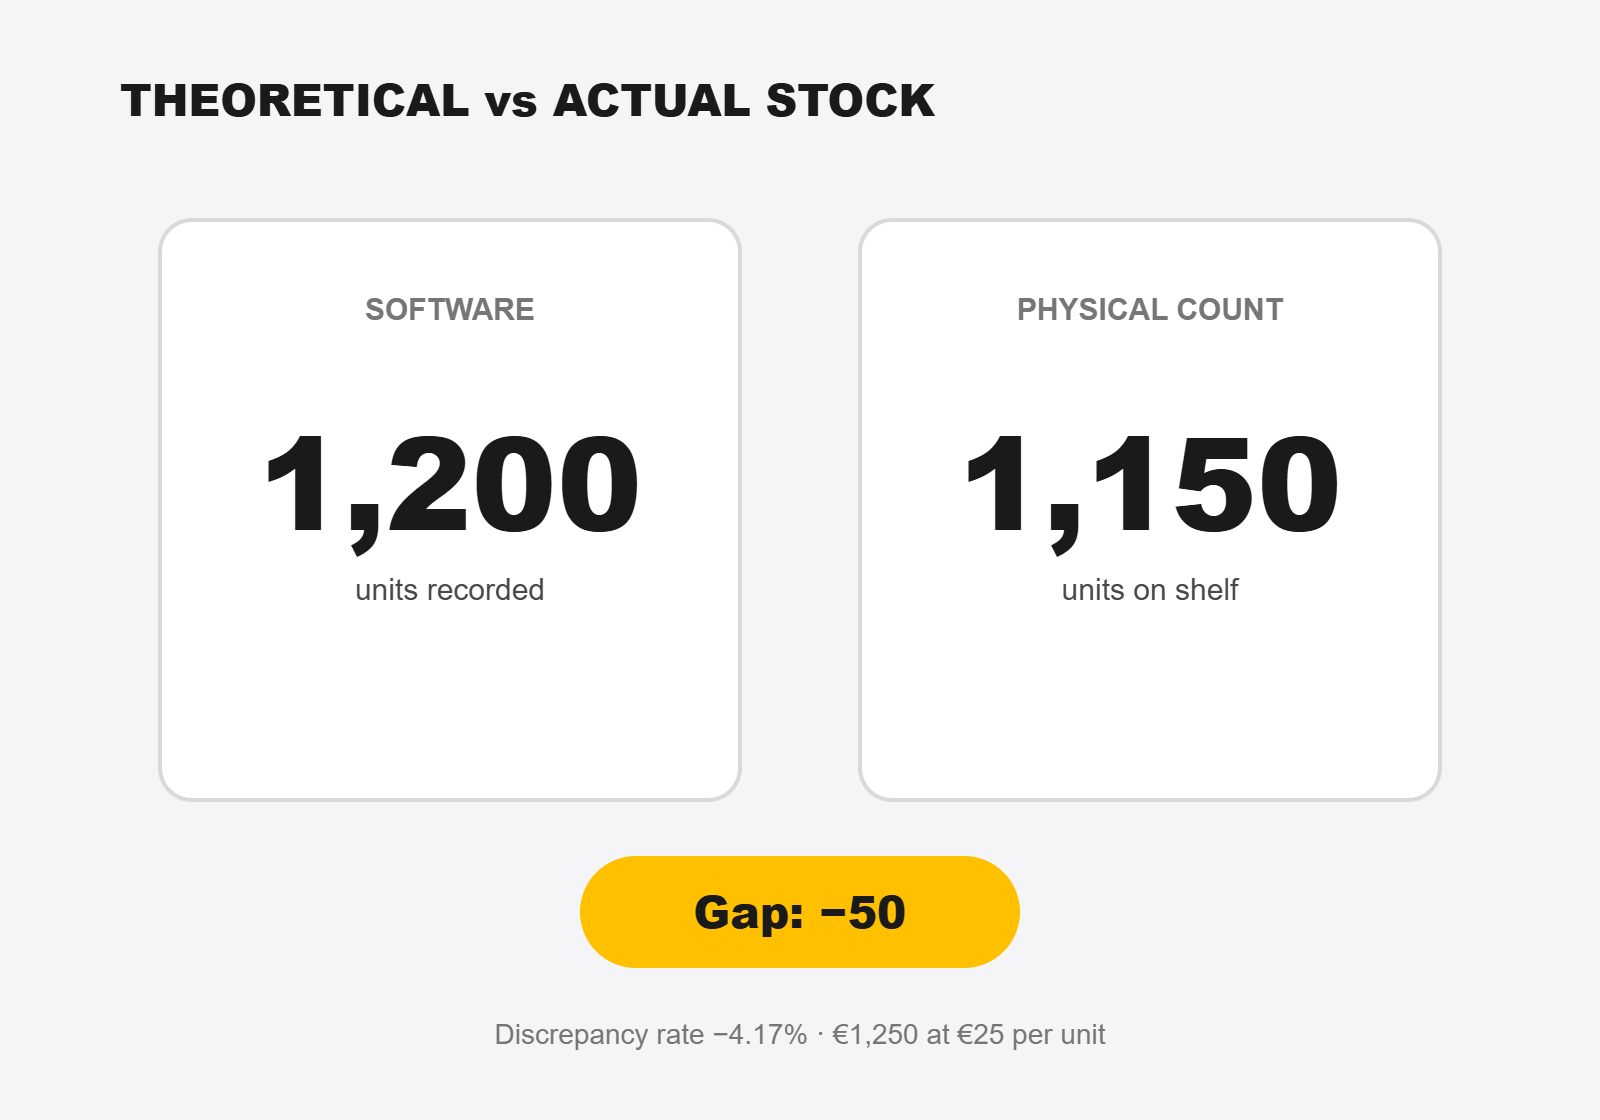
Example used in the table: the system reports 1,200 units, the count finds 1,150, at a unit cost of €25. Across the whole count, 60 of the 500 items counted show a discrepancy.
| Indicator | Formula | Example | What it measures |
|---|
| Discrepancy in quantity | Actual stock - theoretical stock | 1,150 - 1,200 = -50 units | A shortage (negative result) or a surplus (positive result) |
| Discrepancy in value | Discrepancy in quantity × unit cost | -50 × €25 = -€1,250 | The real financial impact of the discrepancy on the item |
| Discrepancy rate | (Discrepancy in quantity / theoretical stock) × 100 | (-50 / 1,200) × 100 = -4.17% | The discrepancy on a comparable basis across items |
| Stock accuracy rate | (Items counted with no discrepancy / total items counted) × 100 | (440 / 500) × 100 = 88% | The share of accurate records, the key indicator for managing stock |
A discrepancy rate of -4.17% is well beyond the tolerance threshold and calls for action. Stock accuracy is the clearest indicator for managing stock performance, and the one most often forgotten: it measures not the volume lost but the share of accurate records. According to the landmark study by DeHoratius and Raman (University of Chicago, 2004), covering 370,000 records, 65% of the stock records analysed contained a discrepancy: the real accuracy of an untooled stock is often far lower than teams assume.